 UtkarshSpeaks. – Blogs by Utkarsh Kaushik A learning shed for like minded readers.


“Recruitment is the most essential operation of any business and it pays if done properly”
When organizations hire the right people, train them well and treat them right; these people not only produce great results but also tend to stay with the organizations longer.
The issue is that most people have the data in their ATS, but they tend to miss out a high level overview showing the state of their hiring efforts. While what they actually need is a greater visibility into their hiring activity.
I personally understand this very well owing to the interactions I had with couple of startups facing similar issues. And out of my observations I mostly end up suggesting them a hiring/recruitment dashboard in order to keep an eye on the hiring process.
Single Point Solution
Here is how a one page hiring dashboard should look like:
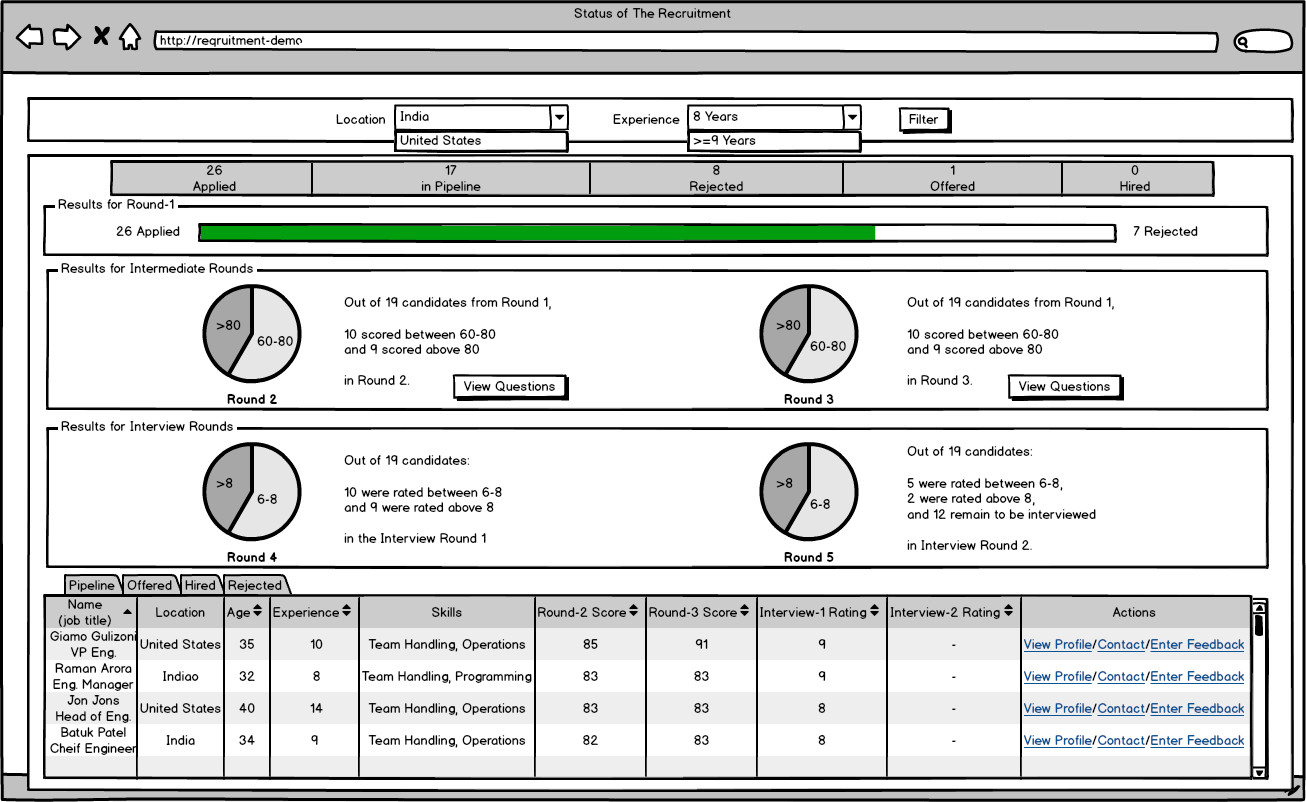
This is just a generalized case and can be customized in any way based on requirements. But this should not just be a bird eye to your process but also the flow guiding your whole hiring process.
Filters
The first thing one may notice is the filters.

Since I personally prefer working remotely, the filters primarily work on location and experience of the candidate. Further attributes like skills and organizations can be added to the filters.
Highlights

The next thing on the top are the highlights, these are kind of summary of the whole process so far. As one can see applied for this position out of which 17 are still in pipeline, while 8 have already been rejected.
Graphical Highlights
The round one area is a qualification round where we only have pass-fail results. The remaining 19 candidates from round one enter the round two and three.
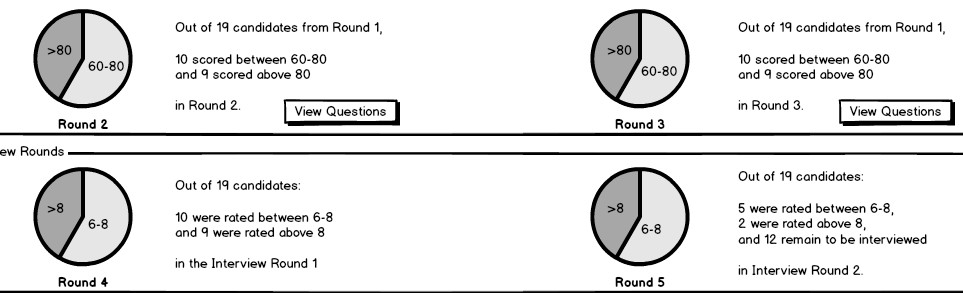
As we can see no one here has score below 60. This can be either because the candidates applying are pretty good or maybe because the qualification exam was too good to allow any weak candidates. Then comes the interview rounds where candidates have to be rated on a scale of 10. The pie chart is similar to the round two and three as these follow a similar concept.
This type of analysis is necessary to understand the type of candidates being received. It lets you refine the job description guidelines and even the qualification exam rules so as to have better results.
In the end the candidates who are most suitable to fr the job should come forth to the direct interview rounds. This not only reduces the hassles at the manager-end but also saves the hr team from sending too many of regret mails.
Data Grid
Then comes the data grid.
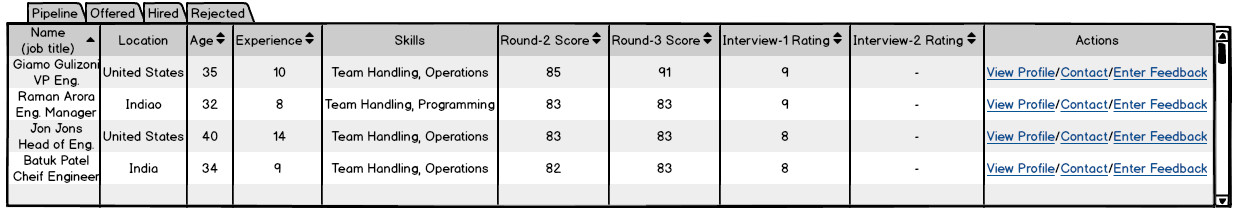
The data grid lists the tuples related to the individual candidates categorized on basis of their application status. The columns in each category remains the same. The table gives the manager a summary of the candidate’s profile by giving relevant data like: name, current job title, location, age, experience, skill-set, scores and rating in different rounds.
And just in case the manager wants to take a deeper look into the profile the view would open a modal with a detailed candidate profile. The contact option allows the manager to write a mail and also provide the contact details of the candidate.
Profiling
Here is how the candidate profile would ideally look like:
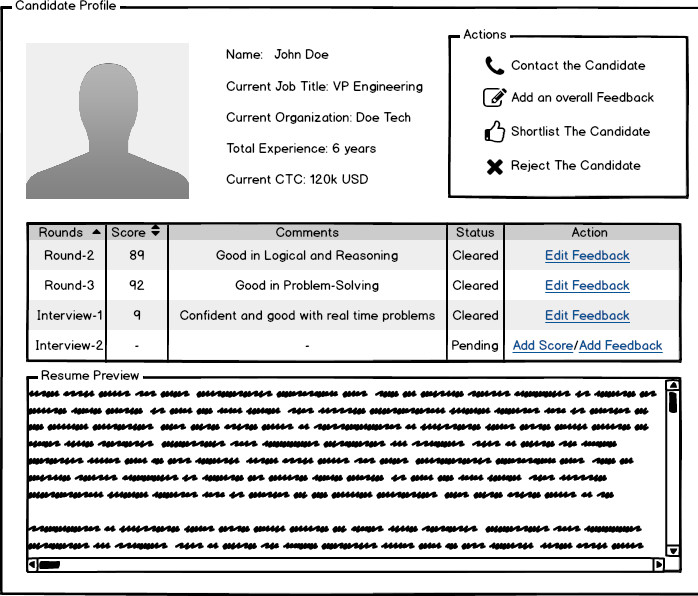
As one can see, it gives out all the details related to the candidate. The resume preview enables manager to view the complete CV there itself, without having troubles of downloading it.
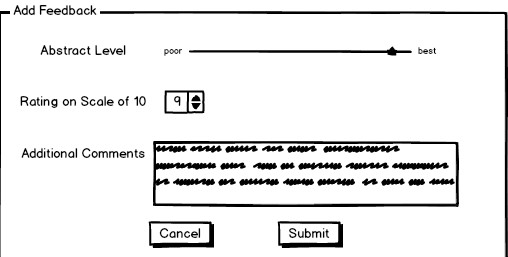
The add feedback download not only gives the manager an ability to comment and rate but also allows the manager to place candidates abstractively on a scale between poor and best.
Further there can be tweaks to your dashboard like: automated alerts and notifications on your mails, so that you don’t need to have trouble of keeping track with your to do list
With a tool like this with the managers the hiring won’t be the same pain again.
These types of tools not only allow a manager to know the status of hiring process but also proves to be helpful in reducing the TAT of whole process. They prove a boon to the recruiter by giving an analysis of figures like: average time spent on a profile, total number of people interviewed vs total number hired and so on.
So don’t just spend your money and time on recruitment of your ideal team. Rather have a similar dashboard to do the thinking over.
“The secret of my success is that we have gone to exceptional lengths to hire the best people in the world” – Steve Jobs